Total revenue test
In economics, the Total Revenue Test is a means for determining whether demand is elastic or inelastic. If an increase in price causes an increase in total revenue, then demand can be said to be inelastic, since the increase in price does not have a large impact on quantity demanded. If an increase in price causes a decrease in total revenue, then demand can be said to be elastic, since the increase in price has a large impact on quantity demanded.
Examples:
1. Product A currently sells for $10. The seller decides to increase the price to $15, but finds that he ends up making less money. This is because he is selling fewer of the product due to the increased price, and his total revenue has fallen. The demand for this product must be elastic.
2. Product A currently sells for $10. The seller decides to increase the price to $15, and finds that his revenue ends up increasing. The demand for this product must be inelastic.
Mathematical explanation
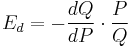
The mathematical link between them comes from the formula of the price elasticity of demand:

Where  stands for Price,
  for quantity demanded,
  for change in quantity demanded,
  for change in price.[1]
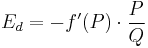
Using the idea of limits, it’s easy to convert the formula into:
or even
On the other hand, total revenue is given by 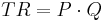 .
.
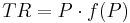
Since Q is a function of P,  total revenue can be rewritten as
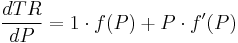
The differential of total revenue with respect to P is thus:
But , so 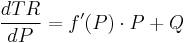 .
.
After both multiplying and dividing by , the equation can be rewritten as:
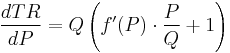
The last step is to substitute the elasticity of demand for  to obtain:
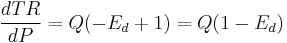 .
.
To find the elasticity of demand using the mathematical explanation of the total revenue test, it’s necessary to use the following rule:
If demand is elastic,  , then
  : price and total revenue move in opposite directions. If demand is inelastic,
  , then
  : price and total revenue change in the same direction. If demand is unit elastic,
  , then
  : an increase in price has no influence on the total revenue.
Graph explanation
Total revenue can be represented by a square or a rectangle formed by connecting the following four points on the demand graph: Price (P), Quantity demanded (Q), Point on the Demand Curve (A) and the origin zero (0) (the intersection of the X axis and the Y axis).
Look at the picture.
This rectangle or square is the measure of total revenue.
When price or quantity change the square changes. The change in total revenue caused by price is called the price effect. The change in total revenue caused by quantity is called the quantity effect.
Look at the graph. When price changes from  to
to  the price effect is represented by the rectangle
  and the quantity effect is formed by rectangle
  .
.
So, if the square of price effect is greater than the square of the quantity effect the demand is inelastic and . If the square of price effect is less than the square of the quantity effect the demand is elastic and . If effects are equal the demand is unit elastic (or unitary elastic).[2]